終了するという話は随分前からされていたのですが,まだ別に先の話(実際に5月までは使えますしね)だということで全然乗り換えとかも考えていませんでした。それが,Wunderlistにブラウザ上でログインするとトップ画面に常に早くMicrosoft To Do(MTD)に移行してねっていうメッセージが表示されるようになり,いよいよ本格的に移行を検討しないといけなくなりました。この話題についてGoogleで探してみてヒットした記事は例えば以下のようなもの。
注2: この方法の一つの問題は,”I ate lunch ,and took a nap.”のようなものが残ってしまうという点です。「半角スペースの直後にピリオドやカンマがあり,その直後に文字列が続く場合には,半角スペースを消して文字列とピリオドやカンマの後に挿入する」のようにすれば解決されます。ただし,関数の入れ子が複雑になる上に単語数カウントには関係ないので今回は無視しています。REGEXREPLACE関数でやるとすれば,次のようなものになるかなと思います。
Google Apps Script(GAS)は,自分で決めたトリガーで定期的に更新できるので,その頻度を好みに設定しておくだけで,定期的にデータを最新のものにするという作業はできます。最初は,ログのspreadsheetファイルにある各チャンネルのシートに列を追加して各行の書き込みの語数を記録し,それを別ファイルにピポットテーブルで吐き出すということを考えました。ちなみに,ログのデータは下の画像のような感じでチャンネルごとにシート1枚で記録されます。
This is an R Markdown document. Markdown is a simple formatting syntax for authoring HTML, PDF, and MS Word documents. For more details on using R Markdown see http://rmarkdown.rstudio.com.
When you click the Knit button a document will be generated that includes both content as well as the output of any embedded R code chunks within the document. You can embed an R code chunk like this:
summary(cars)
##      speed           dist
##  Min.   : 4.0   Min.   :  2.00
##  1st Qu.:12.0   1st Qu.: 26.00
##  Median :15.0   Median : 36.00
##  Mean   :15.4   Mean   : 42.98
##  3rd Qu.:19.0   3rd Qu.: 56.00
##  Max.   :25.0   Max.   :120.00
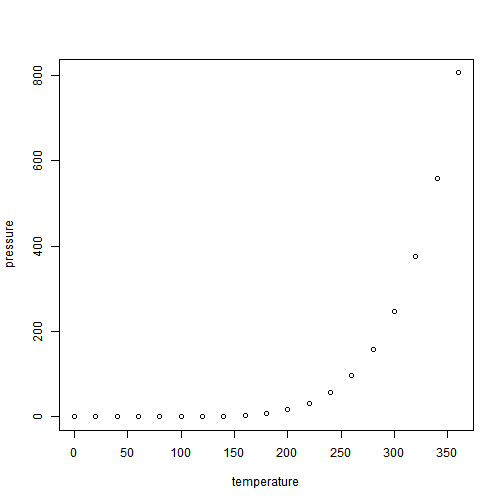
Including Plots
You can also embed plots, for example:
Note that the echo = FALSE parameter was added to the code chunk to prevent printing of the R code that generated the plot.